|
A massive housing needs report released this fall highlights significant affordability and accessibility issues affecting Lebanon County, as well as possible solutions for county planners to consider as they work on building a comprehensive plan. Adequate and affordable housing is often at the heart of the many issues facing guests who seek services at Lebanon County Christian Ministries. LCCM seeks to alleviate the financial burden of people’s basic necessities through its many programs, including the Market on 7th, a charitable food pantry guests can utilize to shop for their own groceries every 14 days, the free noon meal program, utility payment assistance, a clothing bank, the FRESH Start Emergency Shelter & Resource Center, and its newest program, upLIFT, designed to walk long-term with guests as they set goals to increase their personal sustainability and economic strength. As we enter this holiday season, we want to share the reality of the issues deeply affecting our community. Be sure to read “What poverty looks like in Lebanon County, Part 1, food insecurity. Here are 10 highlights about housing and poverty from the Housing Needs Assessment conducted by Bowen National Research: Read the report in its entirety
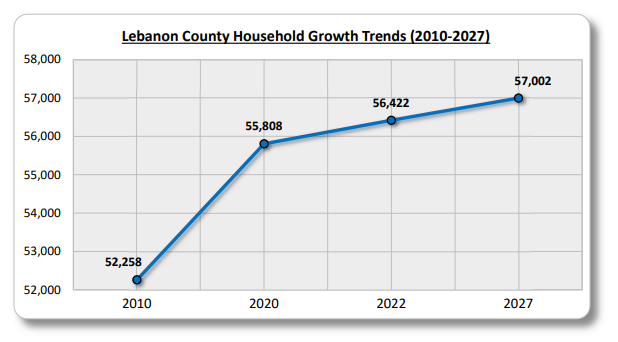
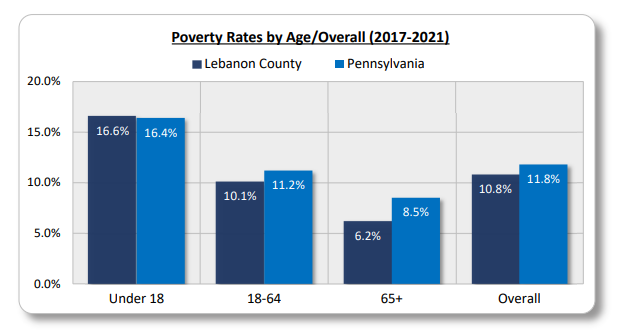
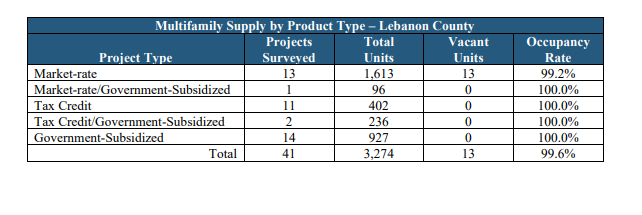
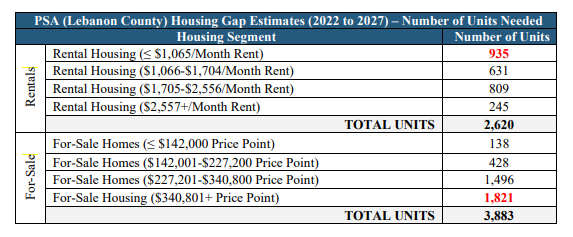
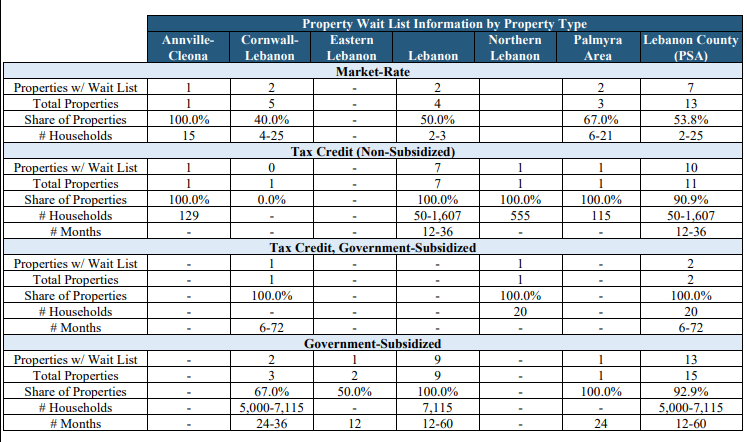
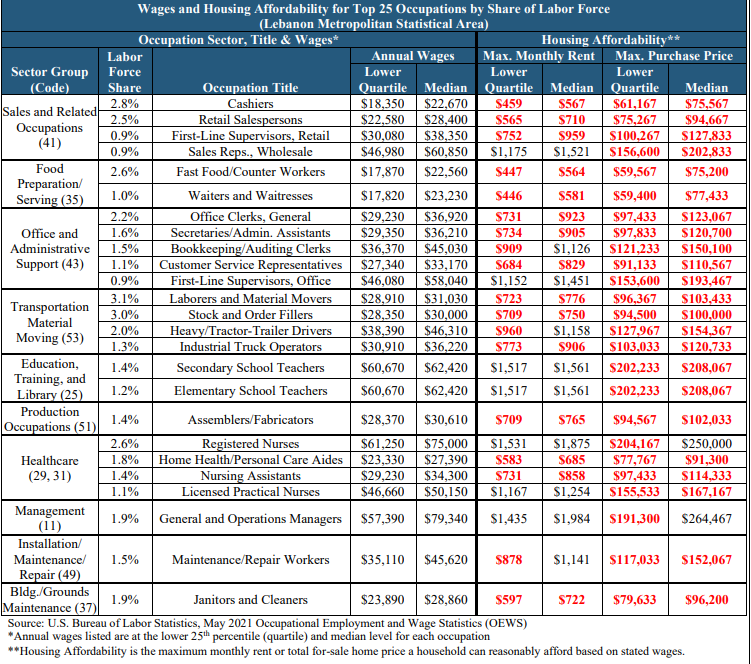
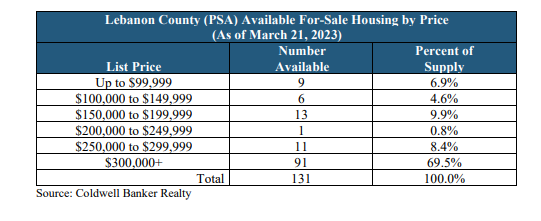
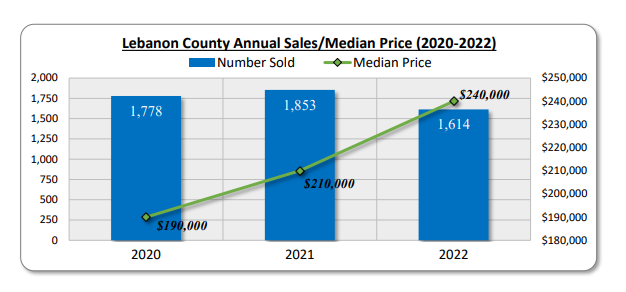
1. The bottom line: Lebanon County in dire need of affordable rentals and for-sale housingIt appears that Lebanon County is most in need of affordable rental (less than $1,000 per month) and for-sale housing (less than $150,000) oriented toward families (two or more bedrooms) with incomes up to $60,000 annually. In addition, it appears that there is a considerable need for studio and one-bedroom housing, as well as senior care housing, primarily for seniors with low incomes/assets. Limited overall availability and rent affordability appear to be the most common housing issues experienced in Lebanon County, and as a result, the repair and revitalization of existing housing appears to be the top housing construction priority among respondents. While the cost of labor, materials, and infrastructure were the most commonly cited barriers to residential development; the collaboration of public and private sectors, home repair assistance, and public education related to housing were considered to be the top priorities by stakeholder respondents. Respondents indicated that landlord/tenant conflict resolution for renters and home repair assistance for owners should also be given priority. Among the special needs populations in the area, permanent supportive housing for persons with a disability, transitional housing for unaccompanied youth, and emergency shelters for the homeless were rated as the top needs. Overall, the consensus of respondents is that the aforementioned housing issues cause residents of the area to live in substandard and unaffordable housing, and the renovation and repurposing of existing buildings should be a focus for the county. 2. housing growth rate in lebanon county outpaces stateThe overall housing growth rate within the county outpaced the state of Pennsylvania since 2010, adding to the demand for housing in the foreseeable future. Between 2010 and 2022, the number of households within Lebanon County increased by 4,164 (8%). This increase in households for Lebanon County is significantly greater than the increase (4.3%) within the state of Pennsylvania during this time period. In 2022, there is an estimated total of 56,422 households in Lebanon County. Between 2022 and 2027, the number of households in Lebanon County is projected to increase by an additional 580 households, or 1%, at which time the estimated total households in Lebanon County will be 57,002. This 1% increase in households for Lebanon County over the next five years is approximately five times the projected growth rate (0.2%) in households for the state during this time period. While this household growth likely indicates a notable increase in demand for housing in Lebanon County over the next five years, it should be noted that household growth alone does not dictate the total housing needs of a market. Other factors, such as households living in substandard or cost-burdened housing, commuting patterns, pent-up demand, availability of existing housing, and product in the development pipeline also affect housing needs. 3. affordable rental units needed to keep pace with low-income households over next 5 yearsAlthough moderate and higher-income households will drive overall demand for housing, the large base of low-income renters and the general limited availability of housing product will contribute to the ongoing need for affordable housing alternatives. The largest increase (25%) of renter households by income in Lebanon County over the next five years is projected among those earning between $60,000 and $99,999, while those earning $100,000 or more are projected to increase by 21.9%. While this represents a significant shift toward higher earning renter households in Lebanon County, nearly one-third (31.8%) of renter households in Lebanon County will continue to earn less than $30,000 annually. Currently, nearly two-fifths (37.6%) of renter households within Lebanon County earn less than $30,000 annually. 4. Over 15,000 people in Lebanon County live in poverty, including nearly one in six childrenOver 15,000 people in Lebanon County live in poverty, including nearly one in six children, indicating that affordable family housing for households earning below $68,000 should be a housing priority for the area. Among the submarkets in Lebanon County, the overall poverty rate is highest within Lebanon city, (24.9%) which totals more than 6,800 people affected by poverty. This submarket comprises 45.2% of the Lebanon County population that is affected by poverty. Individuals less than 18 years of age in the Lebanon city submarket have a poverty rate of 37.9% and are the most disproportionately affected cohort in the county. 5. Significant shortage of rentals available for lower income householdsThere is limited available inventory among multifamily rentals and significant pent-up demand for housing serving lower income renter households. Multi-family apartment properties and other rental housing are both operating at exceedingly high occupancy levels – 99.6% - with very limited availability rates (0.6%). This is among the highest that Patrick Bowen, of Bowen National Research, has seen among the 30 communities he has surveyed in his career, according to a September Lebtown article. Typically, healthy, well-balanced markets have rental housing occupancy rates generally between 94% and 96%. Furthermore, Lebanon County has an overall housing gap of 6,503 units for rental and a for-sale product at a variety of affordability levels. It is projected that Lebanon County has a five-year rental housing gap of 2,620 units and a for-sale housing gap of 3,883 units. While there are housing gaps among all affordability levels of both rental and for-sale product, the rental housing gap is distributed most heavily among the lower priced product (rents of $1,065 or less) and the for-sale housing gap is primarily for product priced at $340,801 or higher. 6. 92% of government-subsidized projects maintain wait listsOver 92% of the government-subsidized projects maintain wait lists. In total, these wait lists among government-subsidized projects in Lebanon County exceed 5,000 households and have a waiting period of up to 60 months. The large share of properties with significant wait lists and the length or duration of such lists indicates a very strong level of pent-up demand for rentals, particularly among the Tax Credit and government-subsidized projects. 7. 14,500 households are paying more than 30% of income toward rent or mortgageMore than 2,000 occupied housing units in the county are considered substandard, while over 14,500 households are housing cost-burdened (or paying more than 30% of their income toward rent or mortgage). The lack of available multifamily rental housing serving low-income households is likely contributing to the large number of renters living in substandard and/or cost burdened housing situations in the county. 8. There appears to be a mismatch between area wages and affordable housing alternatives While the employment base is growing and the unemployment rate is declining, there seems to be a mismatch between area wages and affordable housing alternatives in the market. As a significant share of the labor force is contained within health care, manufacturing, and retail trade, many workers in the area have typical wages generally ranging between $30,000 and $35,000 annually, likely contributing to the need for lower to mid-priced housing product in the county. Most good to fair quality for-sale housing alternatives are not reasonably affordable to these lower wage-earning workers. Based on this analysis, there appears to be a mismatch between area wages and affordable housing alternatives in the market. 9. Lebanon County housing inventory considered extremely low, indicates limited available supplyOverall, there is a relatively limited amount of for-sale housing available for purchase in Lebanon County and a notable portion of available housing inventory is priced at $300,000 and above, which likely creates challenges for lower income households seeking home ownership. Lebanon County’s listed homes inventory is extremely low and indicates limited available supply, according to the report. At the time when the analysis was conducted, the county has a vacancy/availability rate of 0.3%, which is well below the normal range for a well-balanced market. When comparing the 131 available units with the overall inventory of 40,169 owner-occupied units, Lebanon County has a vacancy/availability rate of 0.3%, which is well below the normal range of 2% to 3% for a well-balanced for-sale/owner-occupied market. As such, Lebanon County appears to have a disproportionately low number of housing units available to purchase. 10. median price of homes sold within Lebanon County increased by 26.3%The median price of homes sold within Lebanon County increased by 26.3%, or $50,000, between 2020 and 2022. A combination of high mortgage rates and low housing supply in Lebanon County likely restricted housing sale figures in 2023 and contribute to a continued increase in median sale prices. Given the rapid increases in median sale prices, many households, particularly lower income households, are likely to find homebuying a greater challenge. A notable portion of available housing inventory priced at $300,000 and above creates challenges for lower-income households seeking home ownership.
0 Comments
One in 10 Lebanon County residents experience food insecurity. Children are significantly more likely to experience food insecurity in Lebanon County than adults. These are just two major findings from Central Pennsylvania Food Bank’s Hunger Mapping report released this fall that paint a comprehensive picture of what food insecurity looks like in Lebanon County. Food insecurity is an issue Lebanon County Christian Ministries seeks to address with its food programs such as the Market on 7th, a charitable food pantry guests can utilize to shop for their own groceries every 14 days and the free noon meal program. LCCM also provides utility payment assistance, help with clothing, the FRESH Start Emergency Shelter & Resource Center, and its newest program, upLIFT, designed to walk long-term with guests as they set goals to increase their personal sustainability and economic strength. As we enter this holiday season, we want to share the reality of the issues deeply affecting our community. Be sure to read “What poverty looks like in Lebanon County, Part 2, housing. Here are 10 takeaways from hunger mapping report.
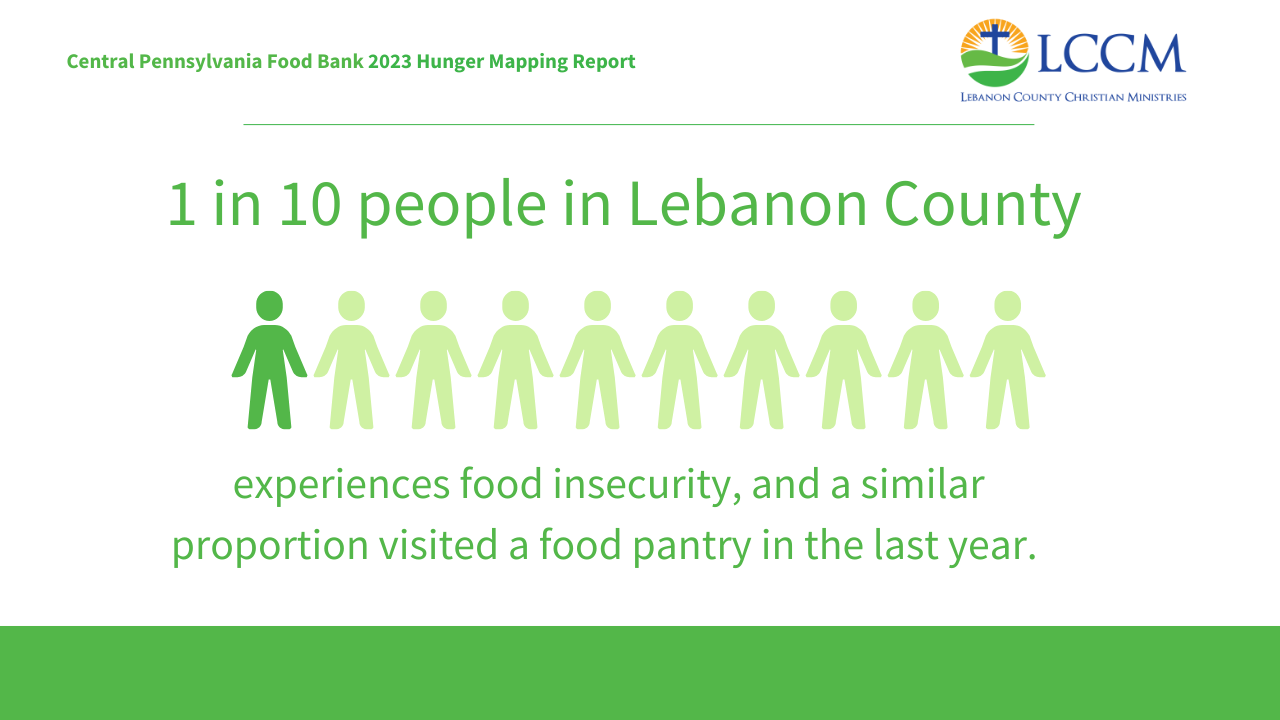
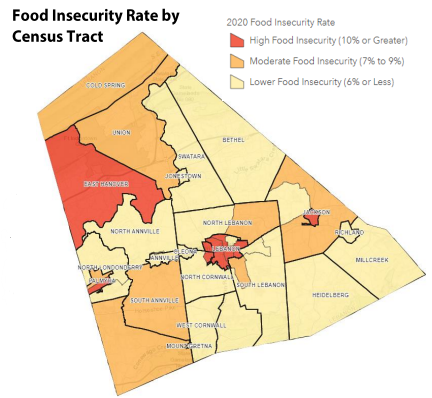
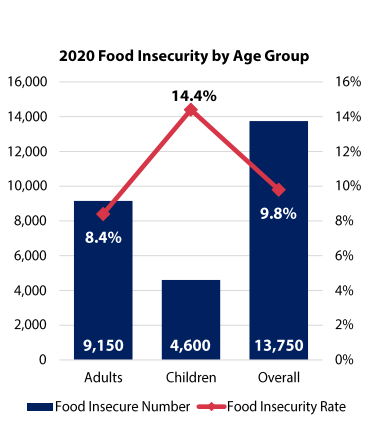
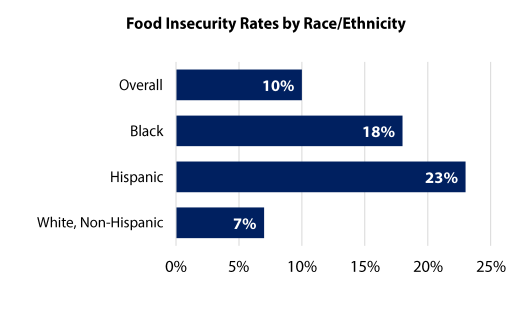
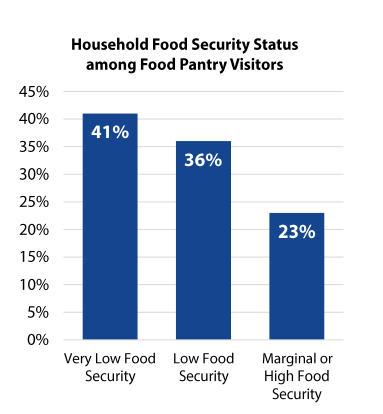
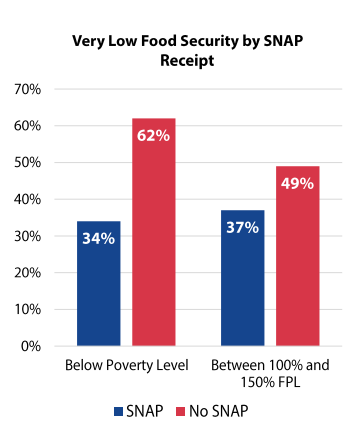
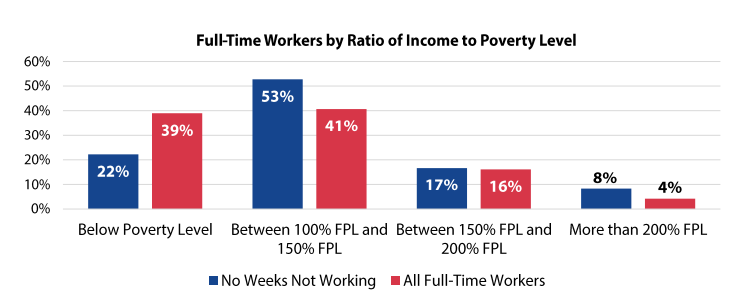
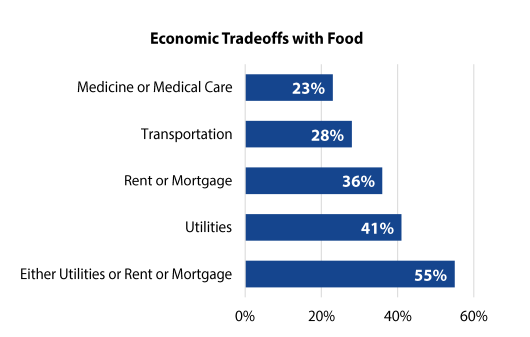
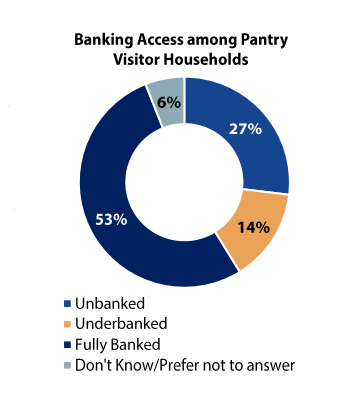
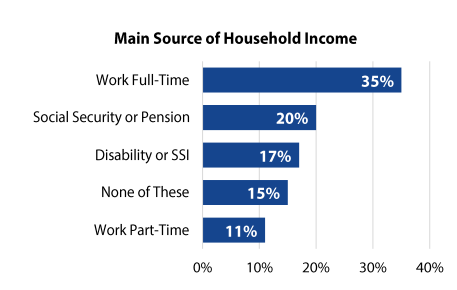
1. 1 in 10 people experience food insecurityOne in 10 (9.8%) Lebanon County residents experience food insecurity, and a similar portion visited a food pantry in the last year. In total, nearly 14,000 individuals in the county are impacted by food insecurity and the charitable food network’s response to it. 2. highest food insecurity concentrated in pockets of lebanon countyThe highest food insecurity areas in the county are concentrated in Lebanon city, West Lebanon, Palmyra, East Hanover Township, and Myerstown. These areas contain 26% of the population of Lebanon County but 53% of all food insecure individuals. Lebanon city is home to 18% of the total population but 39% of all food insecure individuals. 3. children more likely to experience food insecurityChild food insecurity in Lebanon County is a particularly acute issue. Children are 71% more likely to experience food insecurity than adults in Lebanon County with a food insecurity rate of 14.4% compared to 8.4% for adults. This is one of the largest differentials in Pennsylvania and is driven by elevated child poverty rates (38% on average in the high food insecurity areas). The expanded child tax credit caused child food insecurity rates to drop 27% from 14.4% in 2020 to 10.4% in 2021, their lowest level on record in Lebanon County, demonstrating the impact of strategically targeted government investments. Unfortunately, now that its expired, child food insecurity rates are estimated to be around the 14.4% level in 2020. 4. Food insecurity rates are sharply disparate by race and ethnicity in Lebanon CountyFood insecurity rates are sharply disparate by race and ethnicity in Lebanon County. Hispanic individuals in Lebanon County are more than three times as likely to be food insecure as non-Hispanic white individuals, with a food insecurity rate of 23% compared to just 7% among non-Hispanic white individuals. Of the 52 counties with food insecurity data broken out by ethnicity, Lebanon has the 12th highest food insecurity rate among Hispanic individuals, indicating that the disparities in food insecurity by race and ethnicity are particularly acute in Lebanon County. Further, black individuals in Lebanon County have a food insecurity rate of 18%, more than twice that of non-Hispanic white individuals. 5. 41% of all food pantry visitors experience reduced food intake on a regular basisVery low food security, which is characterized by reduced food intake, is extremely prevalent among food pantry visitors throughout Lebanon County. A staggering 41% of all food pantry visitors experience reduced food intake on a regular basis. An additional 36% of food pantry visitors experienced low food security, meaning a combined 77% of food pantry visitors in Lebanon County face USDA-defined food insecurity. Very low food insecurity is impacted by the neighbor experience and utilization of the charitable food network, SNAP participation and participation in key government programs, household income and other systemic economic factors. Rates of very low food security in Lebanon County fall when pantry visitors report utilizing the charitable food system more frequently. This is one of the major reasons why LCCM converted to a client choice pantry in July to not only provide people the dignity of shopping for their own groceries, but also to have more frequent access to nutritious food that will supplement their household groceries. 6. SNAP participation is just 45% among food pantry visitor householdsSupplemental Food Assistance Program (SNAP) participation is just 45% among food pantry visitor households and is middling across the entire county, leaving significant room for improvement. Lebanon County generally underperforms in SNAP participation compared to the rest of the state, with large geographical participation gaps in North Lebanon Township, northwest Lebanon city, Myerstown and the Palmyra area. Additionally, average SNAP benefits fell by 41% ($108 per person, per month) between February and June 2023 due to the end of a COVID-19 pandemic SNAP program flexibility known as SNAP Emergency Allotments. This dramatic drop in average SNAP benefits corresponded with a similarly large 39% increase in food pantry visits during the same period. Participation in SNAP reduces experiences of very low food insecurity among food pantry visitors in Lebanon County substantially. Very low food security rates are 45% lower for pantry visitors with incomes below the poverty level who participate in SNAP than for pantry visitors below the poverty level who do not participate in SNAP (34% compared to 62%). The main reasons individuals report not applying for or participating in SNAP are that they do not think they are eligible, it is too hard to apply, or personal reasons. Over half of food pantry visitors who are not participating in SNAP have never applied before. 7. 40% of households surveyed that work full-time earn less than the federal poverty levelIncome is one of the most important factors that impact a household’s food security status, but 40% of households that work full-time earn less than the federal poverty level. Irregular and inconsistent hours have a major impact on total monthly earnings and corresponding food security status, as households who reported working every week in the last year have poverty rates close to half of households with less reliable work arrangements. 8. Over half of pantry visitor households report choosing between food and utilities or rent/mortgageOver half of pantry visitor households report choosing between food and utilities or rent/mortgage, which were the most highly reported economic tradeoffs. Fully 41% of households reported having to chose between paying for utilities and food, while 36% of households reported having to choose between paying the rent or mortgage and food. Combined, over 55% of households must choose between food and utilities or housing. Furthermore, 21% of food pantry visitors have either experienced a forced move in the last year or are worried about being forced to move in the coming year. A total of 8% of pantry visitors have been forced to move (including evictions and foreclosures) and 21% are worried about being forced to move. 9. Over 40% of pantry visitors are unbanked or underbankedOver 40% of pantry visitors are unbanked (27%) or underbanked (14%), which reduces the economic mobility pathways available to food insecure households in Lebanon County. These rates are more than 10 times the statewide average and nearly five times the national average of 4.5%. 10. a majority of pantry visitors work full timeA total of 72% of pantry visitors report working either full time, receiving Social Security, or receiving Social Security Disability (SSDI) payments, with the most common work experience being full-time work. An additional 11% of households reported working part time. This means that less than 30% of households are unemployed or underemployed. |
Lebanon County Christian MinistriesArchives
July 2024
Categories |
||||||||||||
Call Us:
Email Us:





 RSS Feed