|
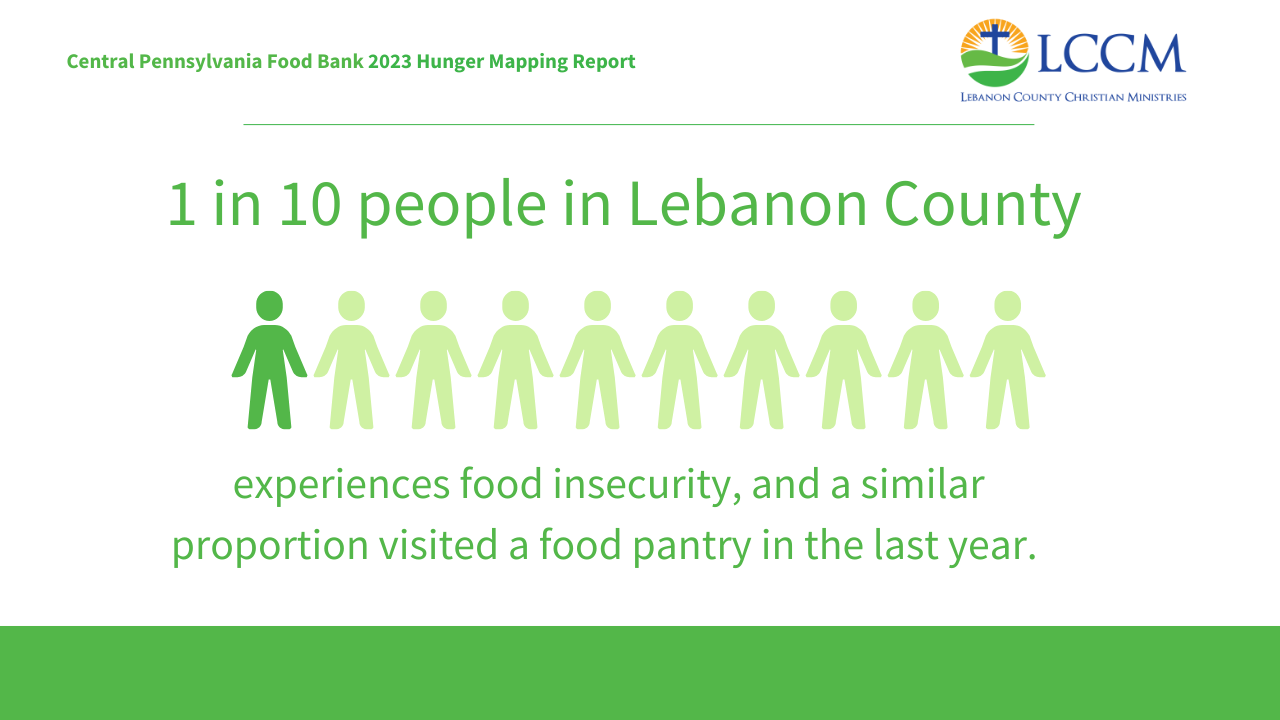
One in 10 Lebanon County residents experience food insecurity. Children are significantly more likely to experience food insecurity in Lebanon County than adults. These are just two major findings from Central Pennsylvania Food Bank’s Hunger Mapping report released this fall that paint a comprehensive picture of what food insecurity looks like in Lebanon County. Food insecurity is an issue Lebanon County Christian Ministries seeks to address with its food programs such as the Market on 7th, a charitable food pantry guests can utilize to shop for their own groceries every 14 days and the free noon meal program. LCCM also provides utility payment assistance, help with clothing, the FRESH Start Emergency Shelter & Resource Center, and its newest program, upLIFT, designed to walk long-term with guests as they set goals to increase their personal sustainability and economic strength. As we enter this holiday season, we want to share the reality of the issues deeply affecting our community. Be sure to read “What poverty looks like in Lebanon County, Part 2, housing. Here are 10 takeaways from hunger mapping report.
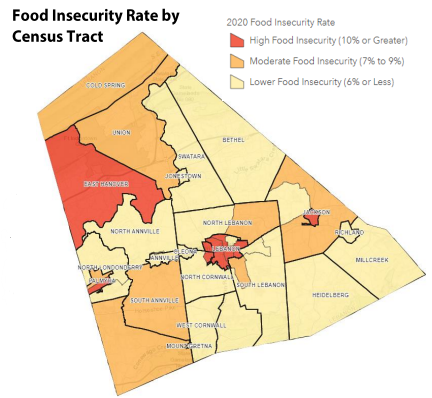
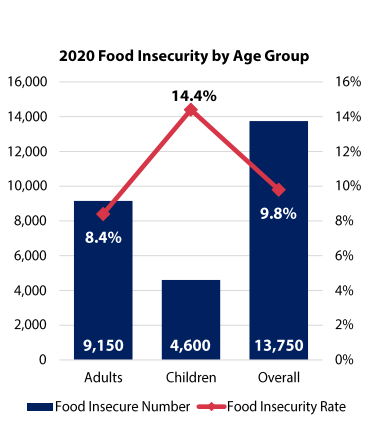
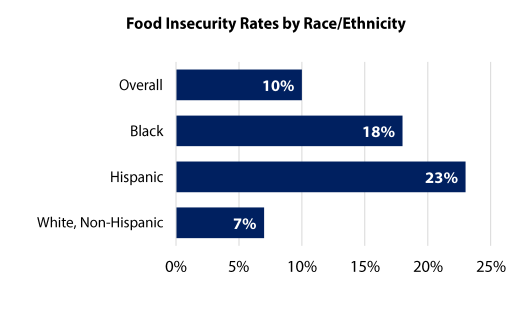
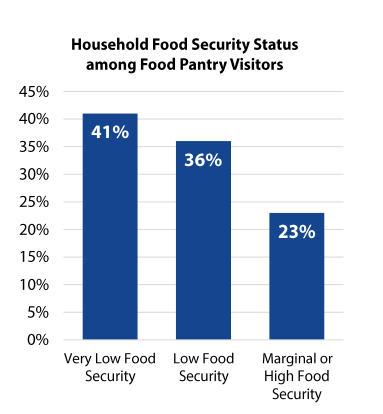
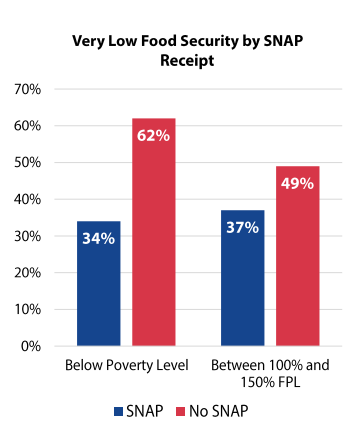
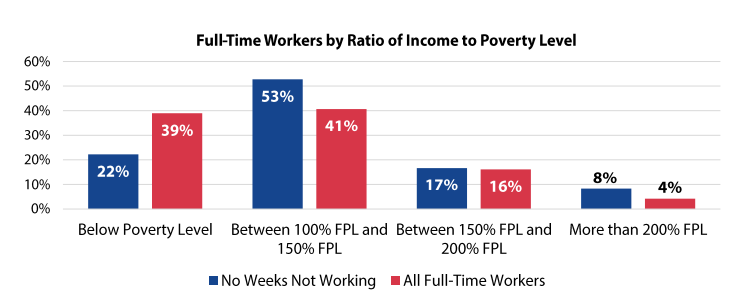
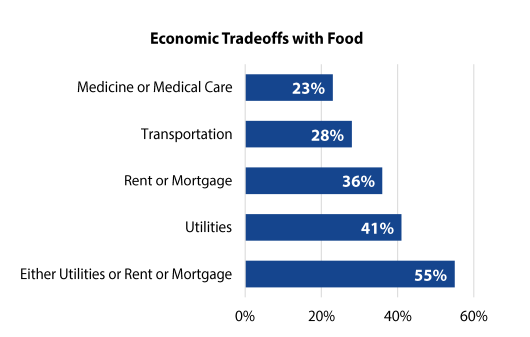
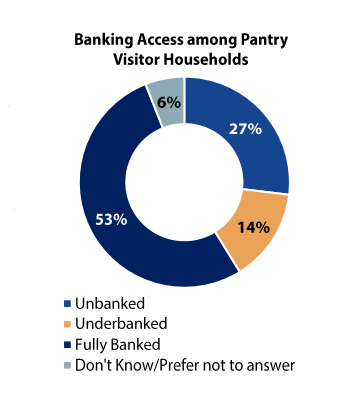
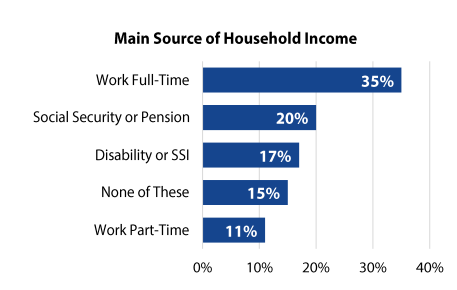
1. 1 in 10 people experience food insecurityOne in 10 (9.8%) Lebanon County residents experience food insecurity, and a similar portion visited a food pantry in the last year. In total, nearly 14,000 individuals in the county are impacted by food insecurity and the charitable food network’s response to it. 2. highest food insecurity concentrated in pockets of lebanon countyThe highest food insecurity areas in the county are concentrated in Lebanon city, West Lebanon, Palmyra, East Hanover Township, and Myerstown. These areas contain 26% of the population of Lebanon County but 53% of all food insecure individuals. Lebanon city is home to 18% of the total population but 39% of all food insecure individuals. 3. children more likely to experience food insecurityChild food insecurity in Lebanon County is a particularly acute issue. Children are 71% more likely to experience food insecurity than adults in Lebanon County with a food insecurity rate of 14.4% compared to 8.4% for adults. This is one of the largest differentials in Pennsylvania and is driven by elevated child poverty rates (38% on average in the high food insecurity areas). The expanded child tax credit caused child food insecurity rates to drop 27% from 14.4% in 2020 to 10.4% in 2021, their lowest level on record in Lebanon County, demonstrating the impact of strategically targeted government investments. Unfortunately, now that its expired, child food insecurity rates are estimated to be around the 14.4% level in 2020. 4. Food insecurity rates are sharply disparate by race and ethnicity in Lebanon CountyFood insecurity rates are sharply disparate by race and ethnicity in Lebanon County. Hispanic individuals in Lebanon County are more than three times as likely to be food insecure as non-Hispanic white individuals, with a food insecurity rate of 23% compared to just 7% among non-Hispanic white individuals. Of the 52 counties with food insecurity data broken out by ethnicity, Lebanon has the 12th highest food insecurity rate among Hispanic individuals, indicating that the disparities in food insecurity by race and ethnicity are particularly acute in Lebanon County. Further, black individuals in Lebanon County have a food insecurity rate of 18%, more than twice that of non-Hispanic white individuals. 5. 41% of all food pantry visitors experience reduced food intake on a regular basisVery low food security, which is characterized by reduced food intake, is extremely prevalent among food pantry visitors throughout Lebanon County. A staggering 41% of all food pantry visitors experience reduced food intake on a regular basis. An additional 36% of food pantry visitors experienced low food security, meaning a combined 77% of food pantry visitors in Lebanon County face USDA-defined food insecurity. Very low food insecurity is impacted by the neighbor experience and utilization of the charitable food network, SNAP participation and participation in key government programs, household income and other systemic economic factors. Rates of very low food security in Lebanon County fall when pantry visitors report utilizing the charitable food system more frequently. This is one of the major reasons why LCCM converted to a client choice pantry in July to not only provide people the dignity of shopping for their own groceries, but also to have more frequent access to nutritious food that will supplement their household groceries. 6. SNAP participation is just 45% among food pantry visitor householdsSupplemental Food Assistance Program (SNAP) participation is just 45% among food pantry visitor households and is middling across the entire county, leaving significant room for improvement. Lebanon County generally underperforms in SNAP participation compared to the rest of the state, with large geographical participation gaps in North Lebanon Township, northwest Lebanon city, Myerstown and the Palmyra area. Additionally, average SNAP benefits fell by 41% ($108 per person, per month) between February and June 2023 due to the end of a COVID-19 pandemic SNAP program flexibility known as SNAP Emergency Allotments. This dramatic drop in average SNAP benefits corresponded with a similarly large 39% increase in food pantry visits during the same period. Participation in SNAP reduces experiences of very low food insecurity among food pantry visitors in Lebanon County substantially. Very low food security rates are 45% lower for pantry visitors with incomes below the poverty level who participate in SNAP than for pantry visitors below the poverty level who do not participate in SNAP (34% compared to 62%). The main reasons individuals report not applying for or participating in SNAP are that they do not think they are eligible, it is too hard to apply, or personal reasons. Over half of food pantry visitors who are not participating in SNAP have never applied before. 7. 40% of households surveyed that work full-time earn less than the federal poverty levelIncome is one of the most important factors that impact a household’s food security status, but 40% of households that work full-time earn less than the federal poverty level. Irregular and inconsistent hours have a major impact on total monthly earnings and corresponding food security status, as households who reported working every week in the last year have poverty rates close to half of households with less reliable work arrangements. 8. Over half of pantry visitor households report choosing between food and utilities or rent/mortgageOver half of pantry visitor households report choosing between food and utilities or rent/mortgage, which were the most highly reported economic tradeoffs. Fully 41% of households reported having to chose between paying for utilities and food, while 36% of households reported having to choose between paying the rent or mortgage and food. Combined, over 55% of households must choose between food and utilities or housing. Furthermore, 21% of food pantry visitors have either experienced a forced move in the last year or are worried about being forced to move in the coming year. A total of 8% of pantry visitors have been forced to move (including evictions and foreclosures) and 21% are worried about being forced to move. 9. Over 40% of pantry visitors are unbanked or underbankedOver 40% of pantry visitors are unbanked (27%) or underbanked (14%), which reduces the economic mobility pathways available to food insecure households in Lebanon County. These rates are more than 10 times the statewide average and nearly five times the national average of 4.5%. 10. a majority of pantry visitors work full timeA total of 72% of pantry visitors report working either full time, receiving Social Security, or receiving Social Security Disability (SSDI) payments, with the most common work experience being full-time work. An additional 11% of households reported working part time. This means that less than 30% of households are unemployed or underemployed.
0 Comments
Leave a Reply. |
Lebanon County Christian MinistriesArchives
July 2024
Categories |
||||||
Call Us:
Email Us:


 RSS Feed